Warning
Debugbar can slow the application down (because it has to gather and render data). So when experiencing slowness, try disabling some of the collectors.
Collectors
This package includes with these Collectors enabled by default:
- Queries: Show all database queries
- Messages: Debug messages and objects
- Logger: Show all Log messages (Show in Messages when available)
- Views: Show the currently loaded views.
- Timeline: Timeline with Booting and Application timing
- Route: Show information about the current Route.
- Exceptions: Exceptions and Throwable with stacktrace
- Session: Current session data
- Request: Request data
- Livewire: Only active when Livewire is used
- PhpInfo: Current PHP version
These collectors can be enabled in the config:
- Gate: Show the gates that are checked
- Events: Show all events
- Auth: Logged in status
- Mail: Sent emails
- Laravel Info: Show the Laravel version and Environment.
- Memory: Memory usage
- Config: Display the values from the config files.
- Cache: Display all cache events.
- Models: Loaded Models
- Jobs: Sent emails
- Logs: Logs from the log files
- Pennant: Show Pennant flags
- Files: Show the files that are included/required by PHP.
To enable or disable any of the collectors, set the configuration to true or false. Some collector have additional options in the configuration:
config/debugbar.php
   /*
     |--------------------------------------------------------------------------
     | DataCollectors
     |--------------------------------------------------------------------------
     |
     | Enable/disable DataCollectors
     |
     */

    'collectors' => [
        'phpinfo'         => true,  // Php version
        'messages'        => true,  // Messages
        'time'            => true,  // Time Datalogger
        'memory'          => true,  // Memory usage
        'exceptions'      => true,  // Exception displayer
        'log'             => true,  // Logs from Monolog (merged in messages if enabled)
        'db'              => true,  // Show database (PDO) queries and bindings
        'views'           => true,  // Views with their data
        'route'           => true,  // Current route information
        'auth'            => false, // Display Laravel authentication status
        'gate'            => false,  // Display Laravel Gate checks
        'session'         => true,  // Display session data
        'symfony_request' => true,  // Only one can be enabled..
        'mail'            => false,  // Catch mail messages
        'laravel'         => false, // Laravel version and environment
        'events'          => false, // All events fired
        'default_request' => false, // Regular or special Symfony request logger
        'logs'            => false, // Add the latest log messages
        'files'           => false, // Show the included files
        'config'          => false, // Display config settings
        'cache'           => false, // Display cache events
        'models'          => false,  // Display models
        'livewire'        => true,  // Display Livewire (when available)
        'jobs'            => false, // Display dispatched jobs
        'pennant'         => false, // Display Pennant feature flags
    ],
Database Queries
v1.0 collectors.db
The Query Collector has the following features - Show the executed queries including timing - Show/mark duplicate queries - Show used parameters - Run on-demand 'EXPLAIN' queries and link to Visual Explain (disabled bu default) - Copy the query to clipboard - Show the source of the query and open in editor - Visualize the duration of the queries with bottom border - Add queries to the timeline (disabled by default) - Limit the number of queries to avoid slowing down the Debugbar. - Exclude paths (eg. for session or vendors) - Show memory usage (disabled by default)

config/debugbar.php
  'options' => [
        // ...
        'db' => [
            'with_params'       => true,   // Render SQL with the parameters substituted
            'exclude_paths'     => [       // Paths to exclude entirely from the collector
                // 'vendor/laravel/framework/src/Illuminate/Session', // Exclude sessions queries
            ],
            'backtrace'         => true,   // Use a backtrace to find the origin of the query in your files.
            'backtrace_exclude_paths' => [],   // Paths to exclude from backtrace. (in addition to defaults)
            'timeline'          => false,  // Add the queries to the timeline
            'duration_background'  => true,   // Show shaded background on each query relative to how long it took to execute.
            'explain' => [                 // Show EXPLAIN output on queries
                'enabled' => false,
            ],
            'hints'             => false,   // Show hints for common mistakes
            'show_copy'         => true,    // Show copy button next to the query,
            'slow_threshold'    => false,   // Only track queries that last longer than this time in ms
            'memory_usage'      => false,   // Show queries memory usage
            'soft_limit'       => 100,      // After the soft limit, no parameters/backtrace are captured
            'hard_limit'       => 500,      // After the hard limit, queries are ignored
        ],
        // ...
    ],
On-demand query EXPLAIN
v3.14.0 options.db.explain
Enable the options.db.explain option to run on-demand EXPLAIN queries for any SELECT query in the Debugbar.
This will update in the interface. You also have an option to navigate to mysqlexplain.com for a visual explain.
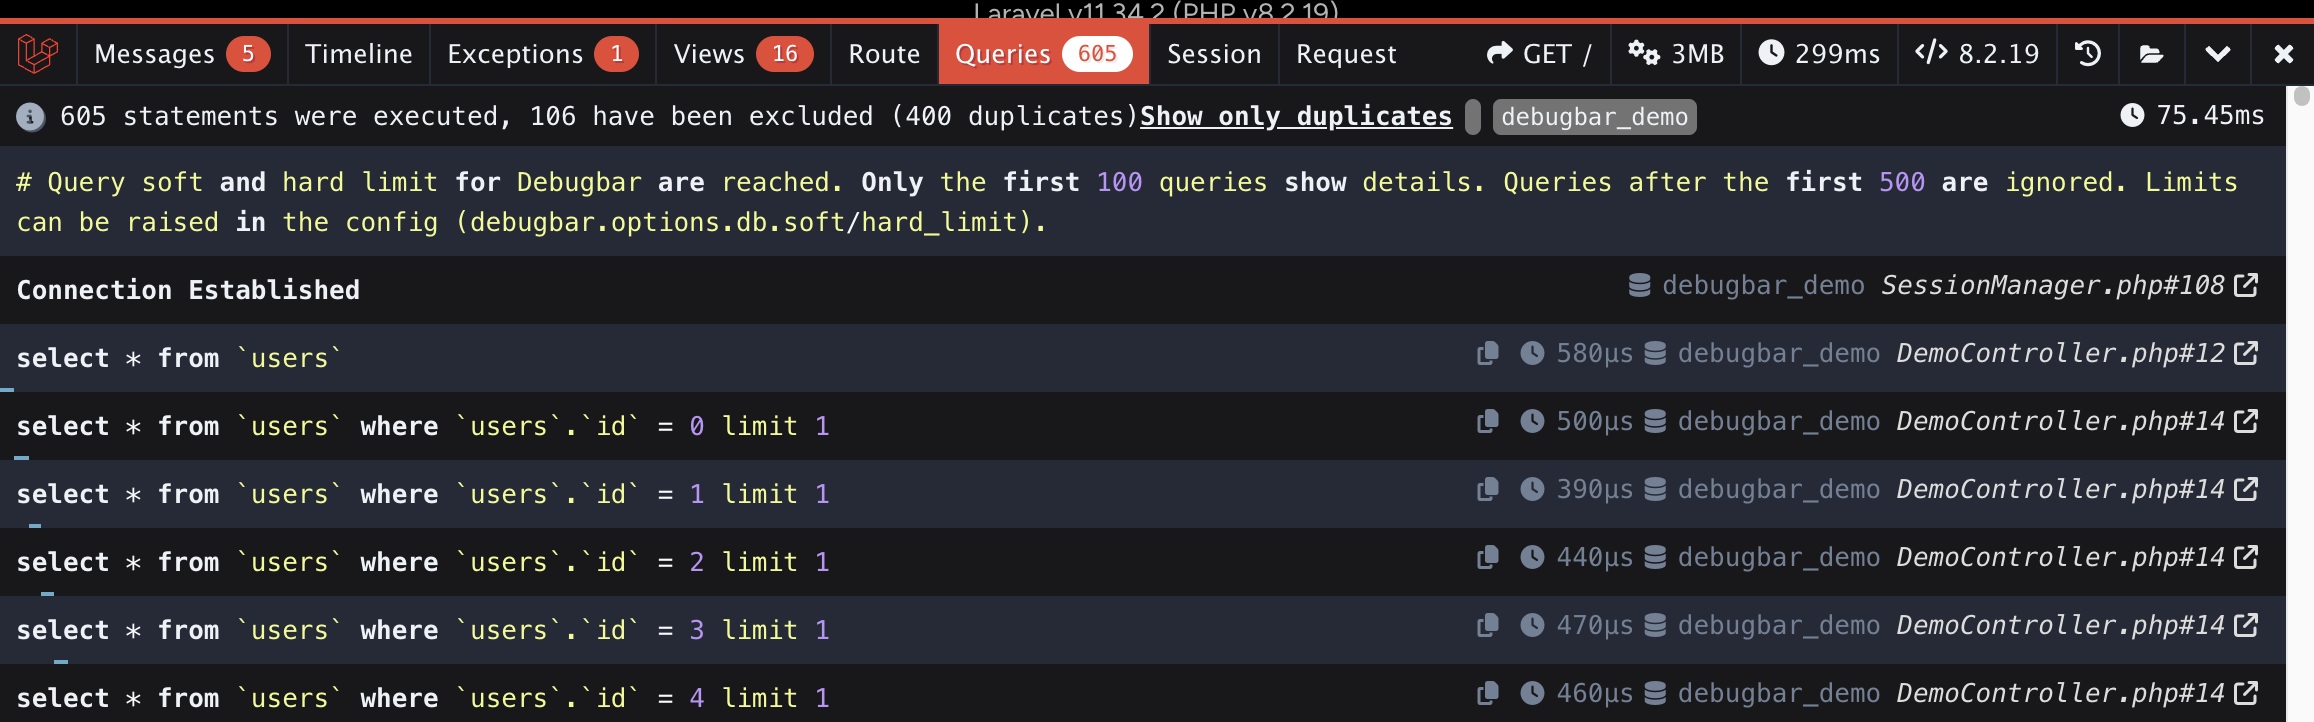
Query limits
v3.10.0 options.db.soft_limit: 100 options.db.hard_limit: 500
With Query Hard & Soft limits, you can reduce the amount of queries shown by default. When the soft limit is reached, bindings will be excluded.
When the hard limit is reached, the queries are excluded altogether to prevent loading too much data.
If you want to avoid any limits, you can set the option to null
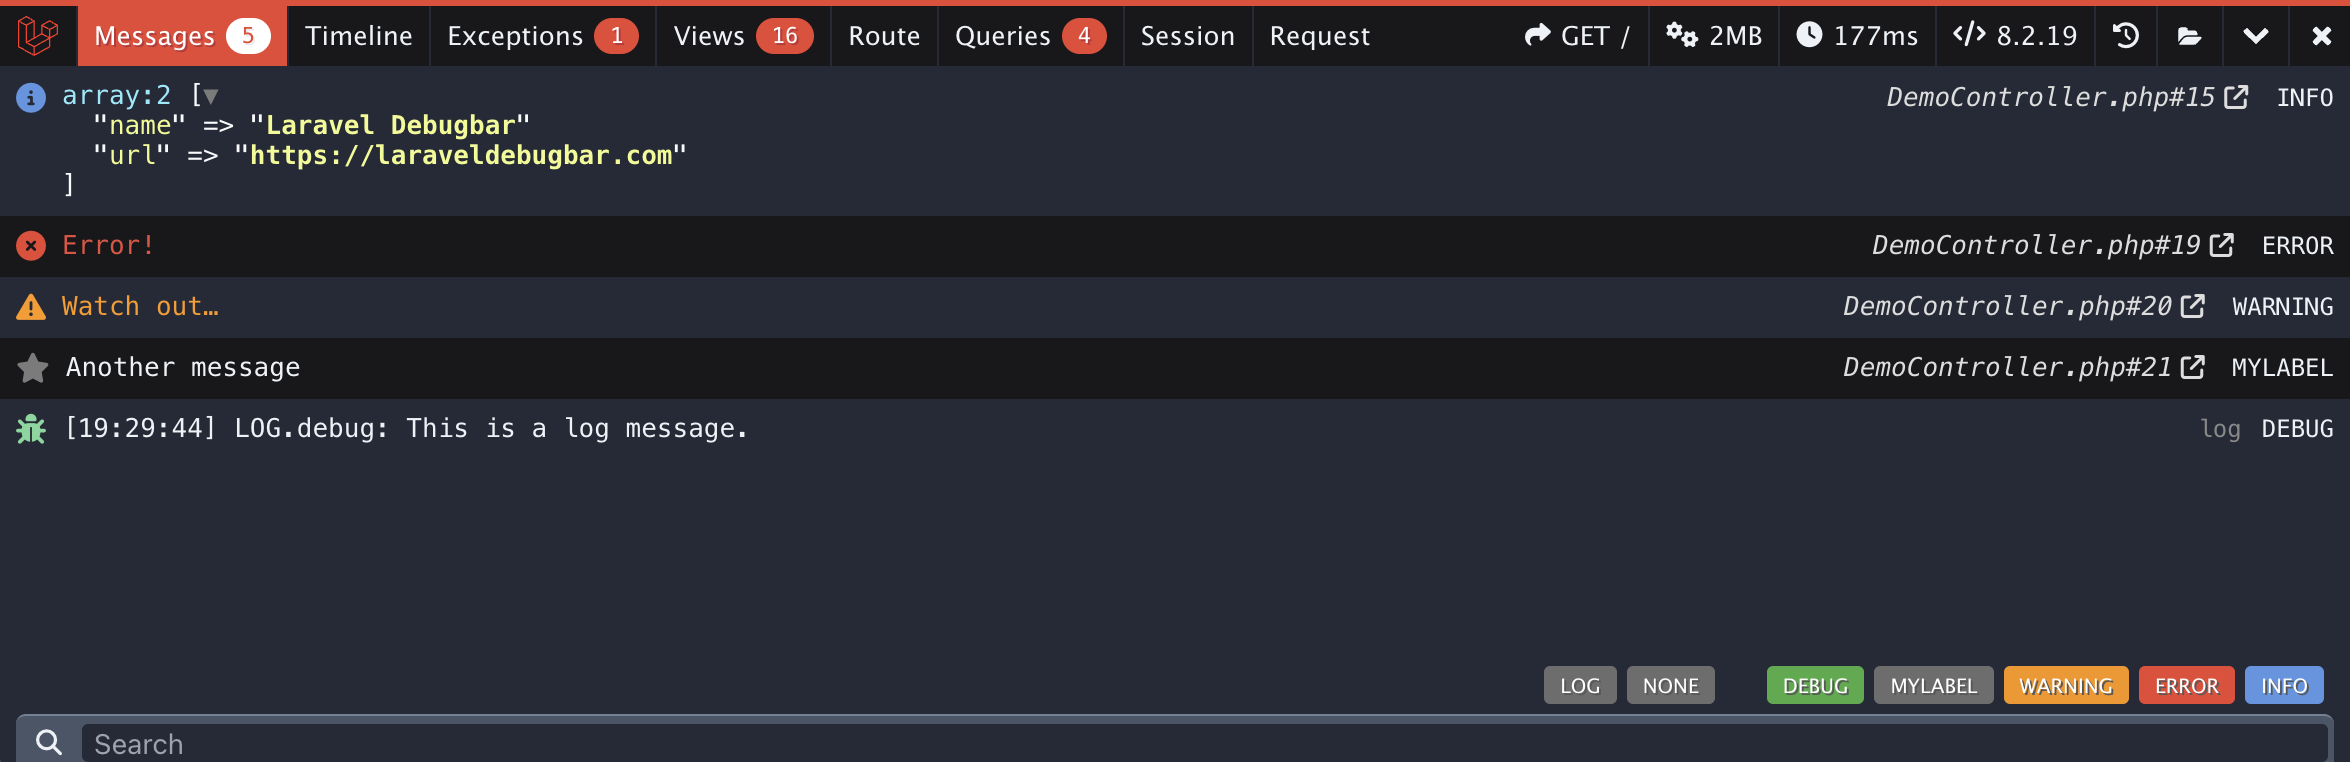
Messages
v1.0 collectors.messages
The Message collectors gathers all messages from debug() calls and anything written to the logs.
You can pass multiple parameters to debug(), even complex object.
Trace
When calling debug(), the source of the call is shown and can be opened with your IDE.
v3.10.0 options.messages.trace
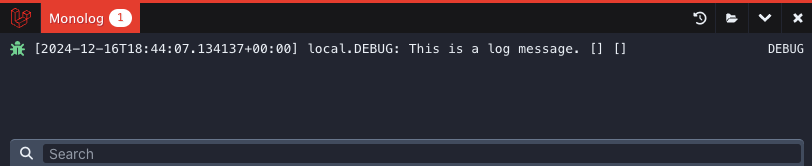
Logger
v1.0 collectors.log
When the Messages Collector is enabled, Log messages are added to the Messages tab. Otherwise a Monolog tab will show with just the log messages
config/debugbar.php
  'options' => [
        // ...
        'db' => [
            'with_params'       => true,   // Render SQL with the parameters substituted
            'exclude_paths'     => [       // Paths to exclude entirely from the collector
                // 'vendor/laravel/framework/src/Illuminate/Session', // Exclude sessions queries
            ],
            'backtrace'         => true,   // Use a backtrace to find the origin of the query in your files.
            'backtrace_exclude_paths' => [],   // Paths to exclude from backtrace. (in addition to defaults)
            'timeline'          => false,  // Add the queries to the timeline
            'duration_background'  => true,   // Show shaded background on each query relative to how long it took to execute.
            'explain' => [                 // Show EXPLAIN output on queries
                'enabled' => false,
            ],
            'hints'             => false,   // Show hints for common mistakes
            'show_copy'         => true,    // Show copy button next to the query,
            'slow_threshold'    => false,   // Only track queries that last longer than this time in ms
            'memory_usage'      => false,   // Show queries memory usage
            'soft_limit'       => 100,      // After the soft limit, no parameters/backtrace are captured
            'hard_limit'       => 500,      // After the hard limit, queries are ignored
        ],
        // ...
    ],
Views
v1.0 collectors.views
The ViewCollector shows views and has the following features:
- Show used templates and source
- Optionally add them to the timeline
- Group similar views (useful for components)
- Exclude folders (eg. for Filament or other vendors)
- Optionally show data (this can be resource heavy)

    'options' => [
        'views' => [
            'timeline' => false,    // Add the views to the timeline (Experimental)
            'data' => false,        //true for all data, 'keys' for only names, false for no parameters.
            'group' => 50,          // Group duplicate views. Pass value to auto-group, or true/false to force
            'exclude_paths' => [    // Add the paths which you don't want to appear in the views
                'vendor/filament'   // Exclude Filament components by default
            ],
        ],
    ]
Timeline
v1.0 collectors.time

config/debugbar.php
Route
v1.0 collectors.route
This shows the current route and middleware.

config/debugbar.php
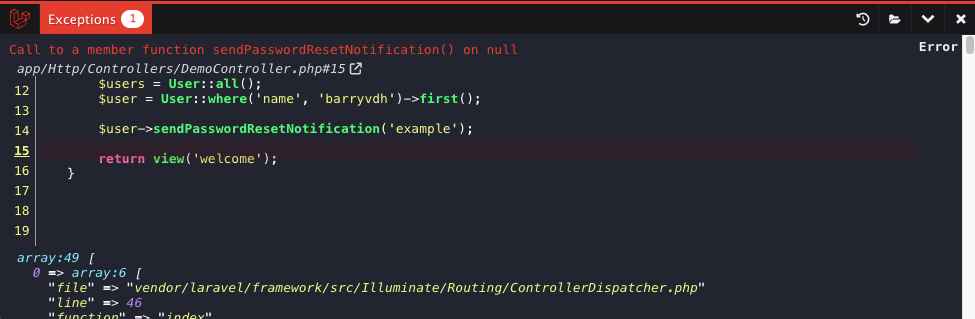
Exceptions
v1.0 collectors.exceptions
Show any errors from the application, including traces.
You can manually add exceptions by calling debugbar()->addThrowable($throwable);
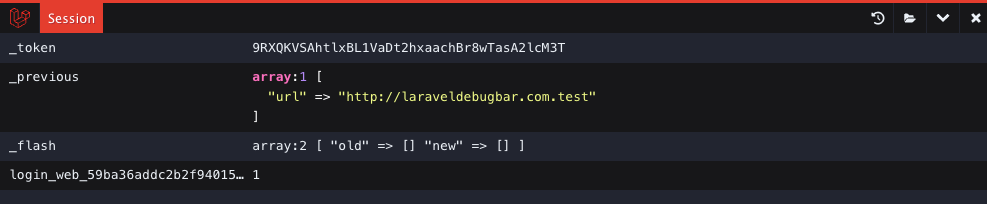
Session
v1.0 collectors.phpinfo false
A simple widget showing the current PHP Version.
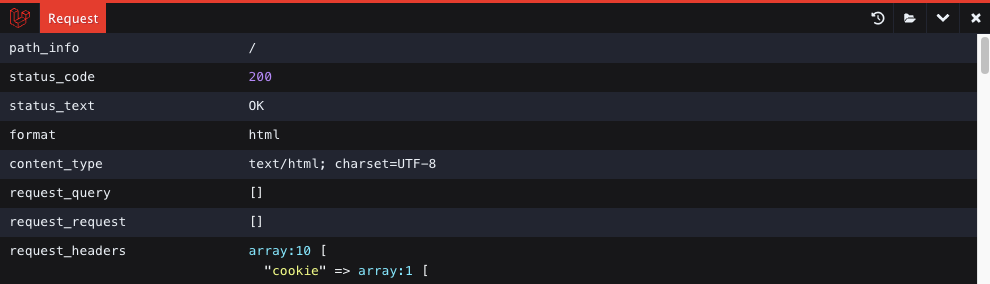
Request
v1.0 collectors.request
Show Request info, like headers, data, cookies etc. Sensitive data is hidden by default, but you can add your own sensitive data to the config.
config/debugbar.php
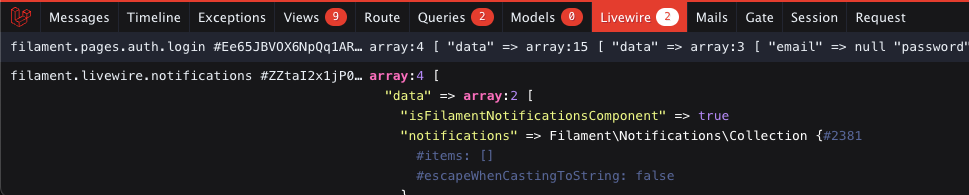
Livewire
v3.3.3 collectors.livewire
Show the Livewire components that are rendered on the page.
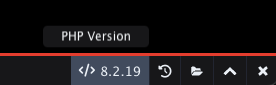
PHP Info
v1.0 collectors.phpinfo
A simple widget showing the current PHP Version.
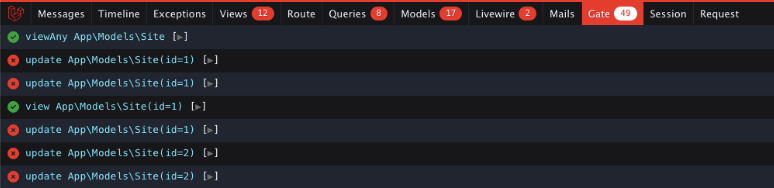
Gate
v2.1.0 collectors.gate false
The Gate Collector shows the checks that have passed or failed.
Events
v1.0 collectors.events
This is similar to the Timeline buts adds all events. This can be a lot of data, so use with caution.
config/debugbar.php
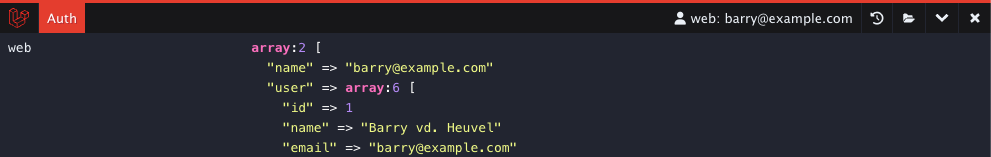
Auth
v1.2.2 collectors.auth false
A widget showing the current login status + a collector with more information.
config/debugbar.php
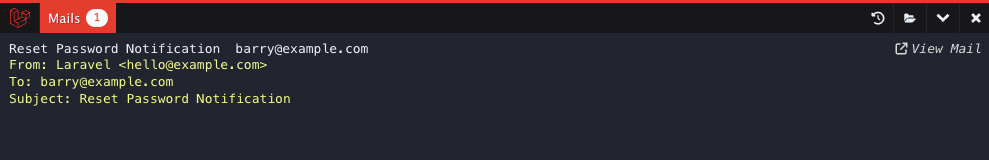
Mail
v1.0 collectors.mail false
A collector showing the sent emails.
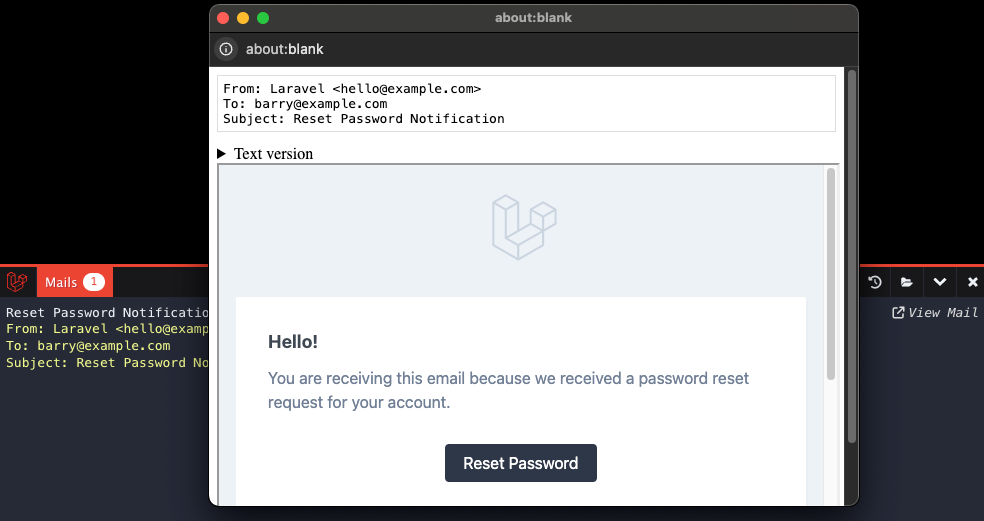
Mail Preview
v3.12.0 options.mail.show_body true
You can open a rendered preview of the email when the body is attached, by clicking 'View Mail'
Laravel Info
v1.0 collectors.laravel false
A widget showing the current Laravel Version, environment and locale.

Memory Usage
v1.0 collectors.memory false
Show the Memory Usage of the application
config/debugbar.php

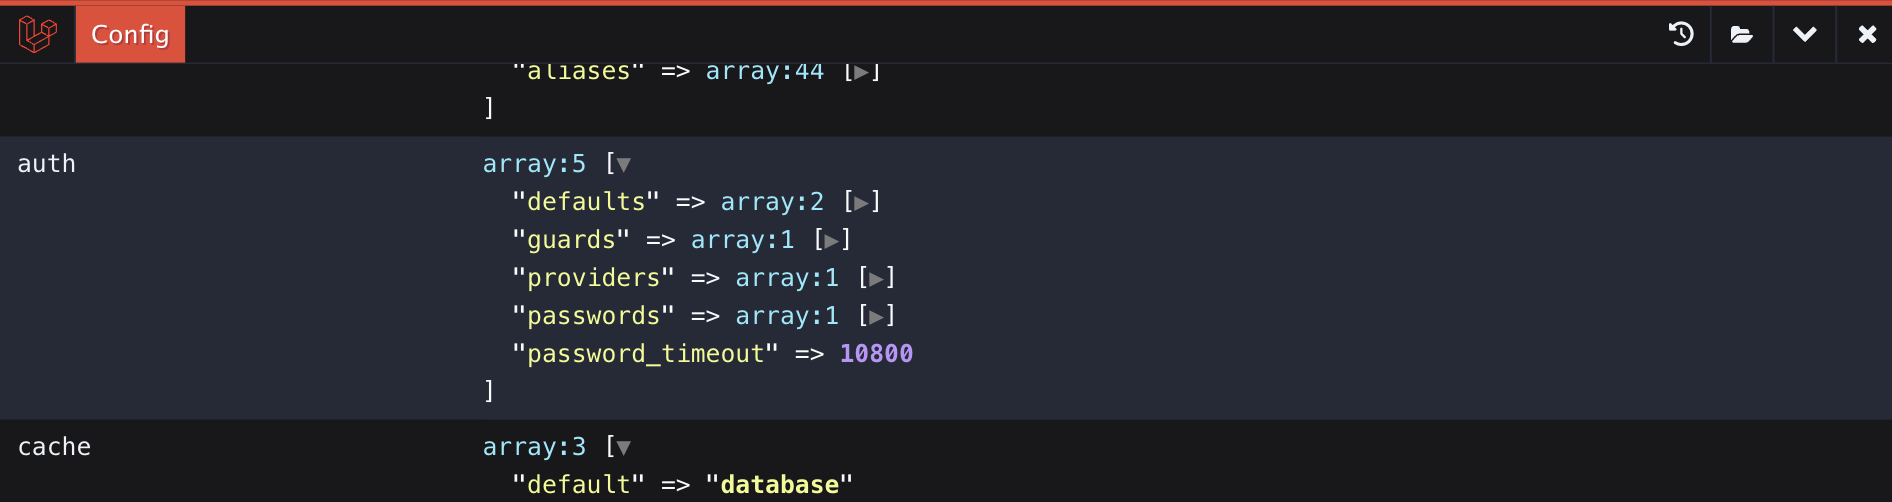
Config
v3.0 collectors.config false
Warning
Be careful when turning this on, as it can expose sensitive credentials. Make sure your app is not publicly available.
Shows the loaded configuration values.
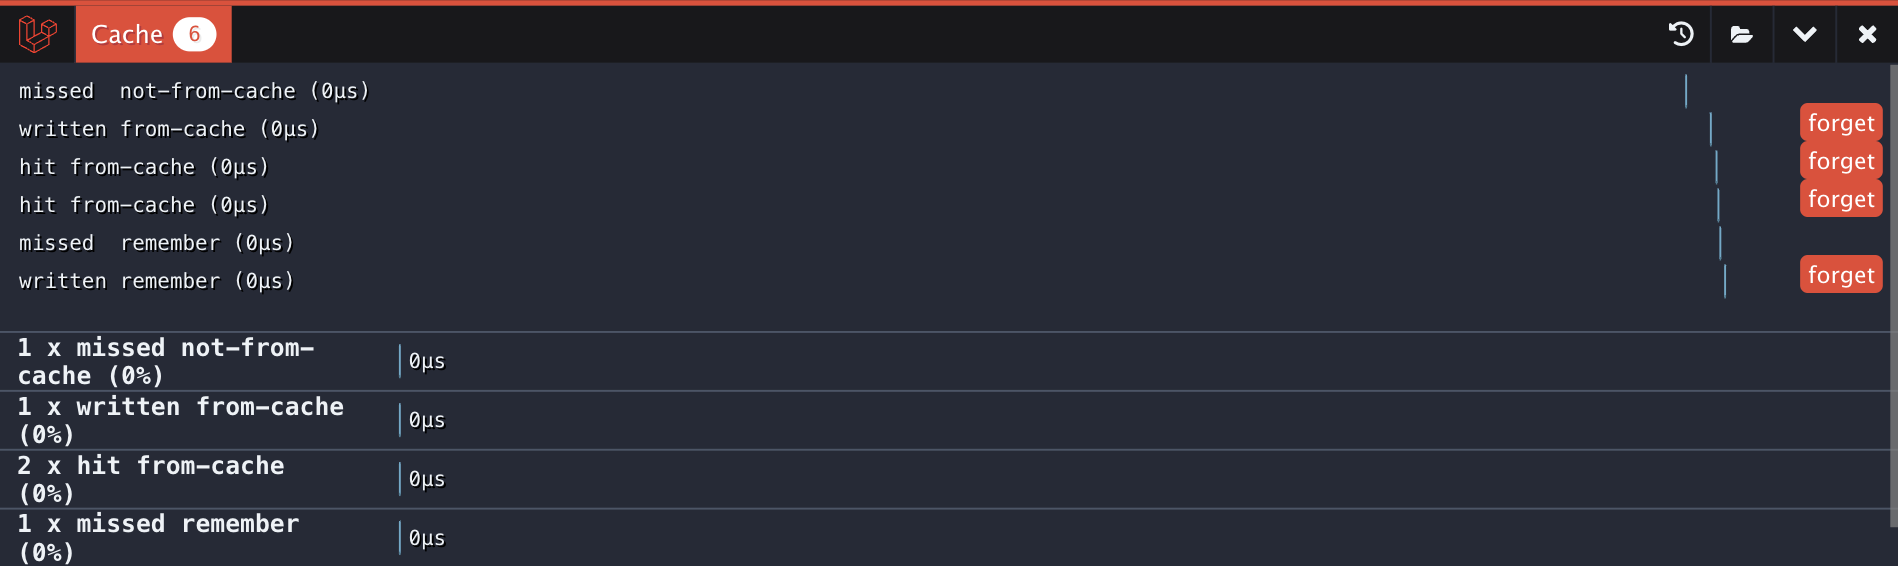
Cache
v3.0.0 collectors.cache false
Show the hits/misses of the Cache in a Timeline.
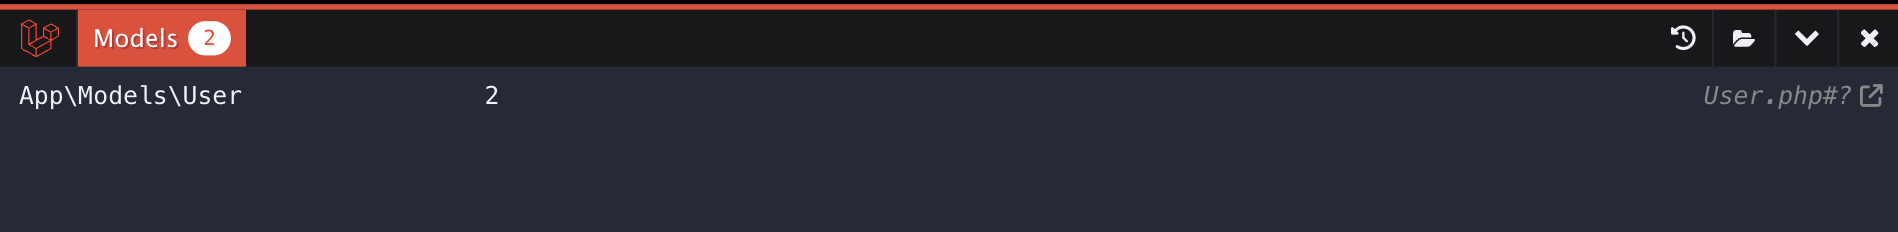
Models
Shows how often each Model is loaded. If this is high, you might want move some logic to SQL instead of processing large Collections.
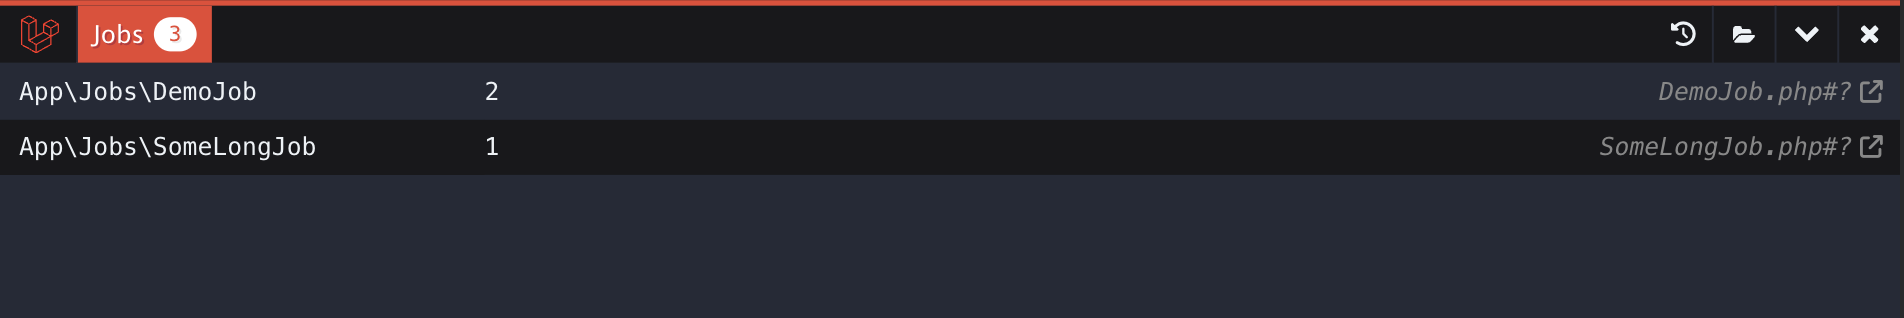
Jobs
Show the Jobs that are dispatched from this request.
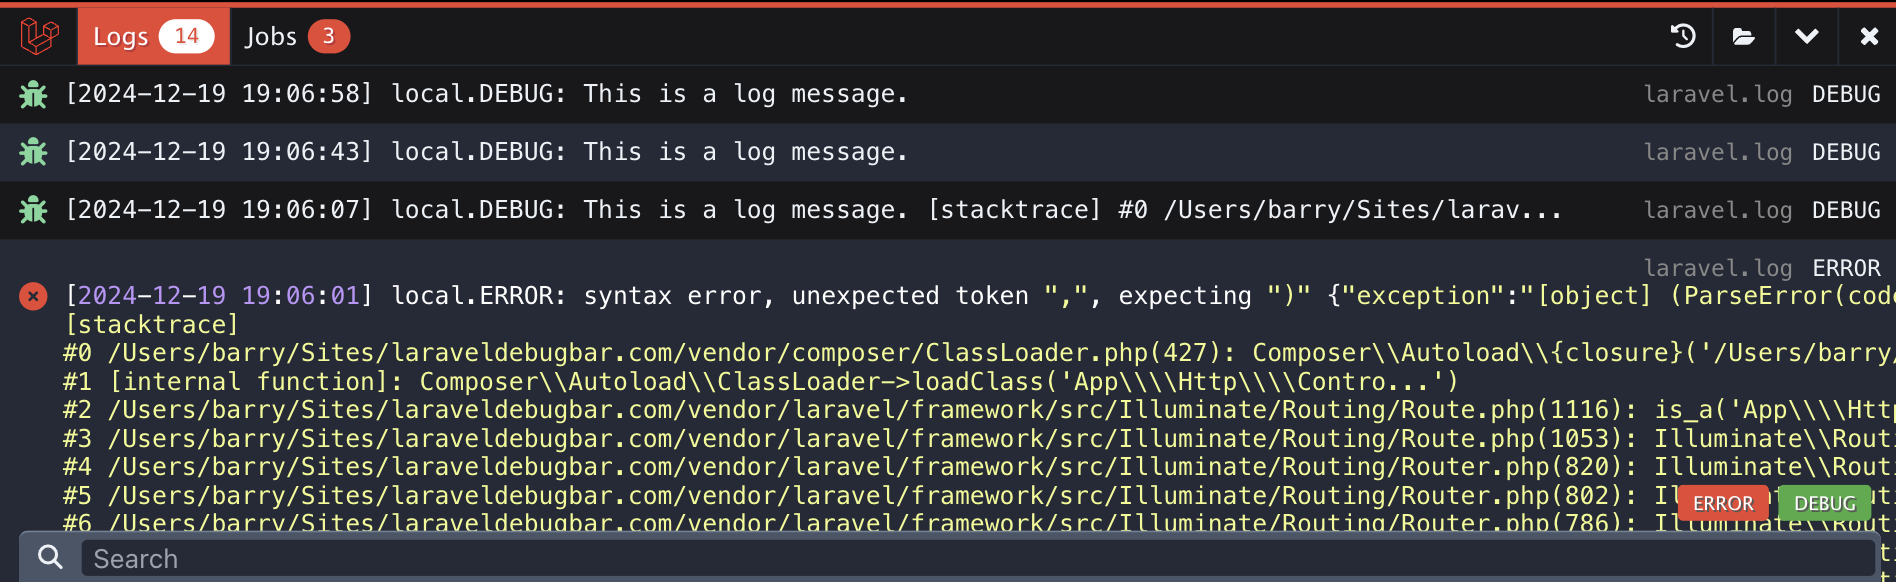
Logs
Show the most recent logs from the log files in storage/logs
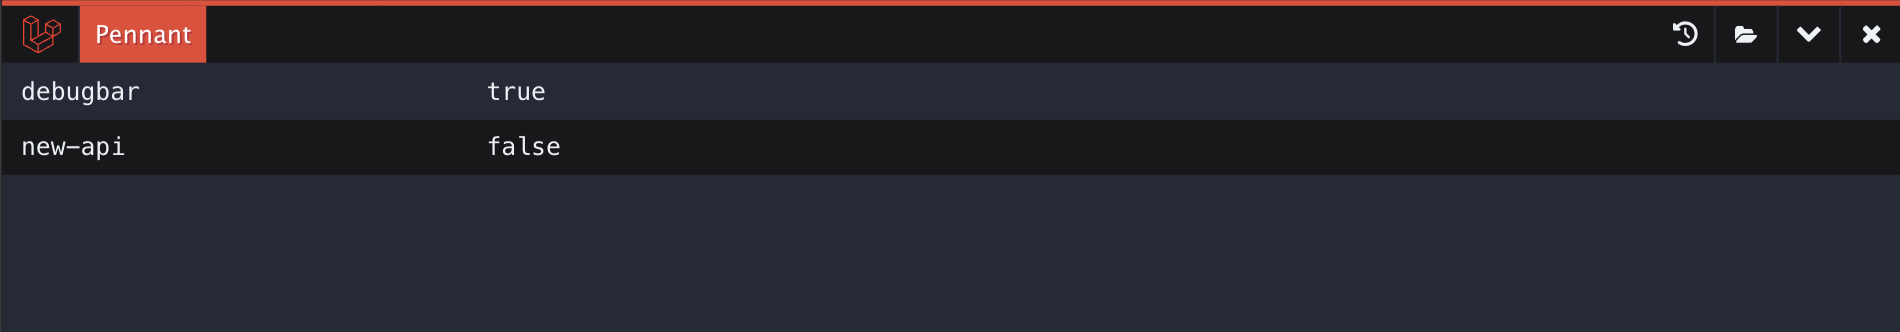
Pennant
v3.14.0 collectors.pennant false
Shows all the Pennant flags that are checked during this request
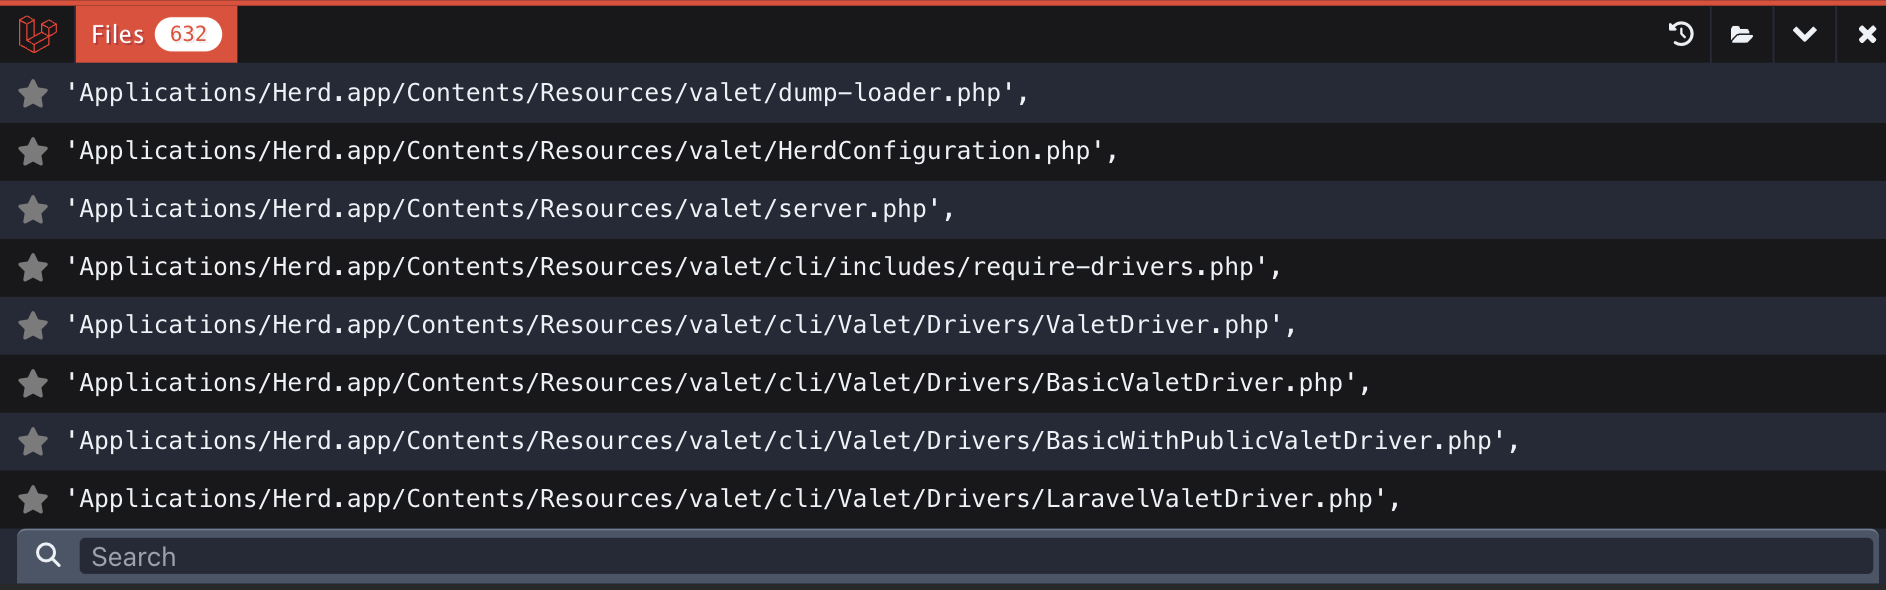
Files
v1.0 collectors.files false
Deprecated
This was mainly useful before OPcache was widely used, and this collector could be used for optimizing files. It's deprecated now.